About pyVib Molecular Graphics Program
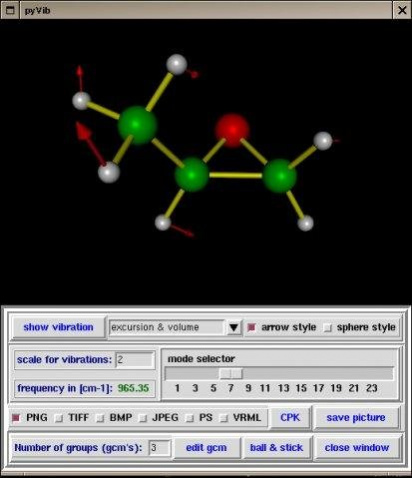
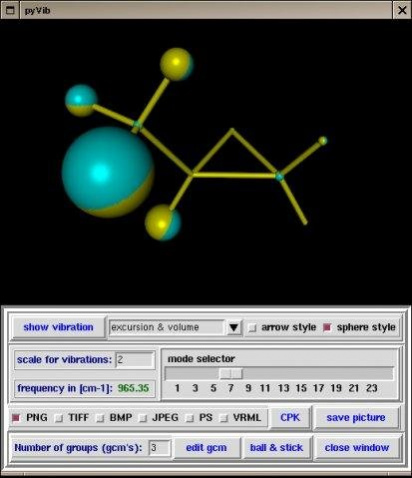
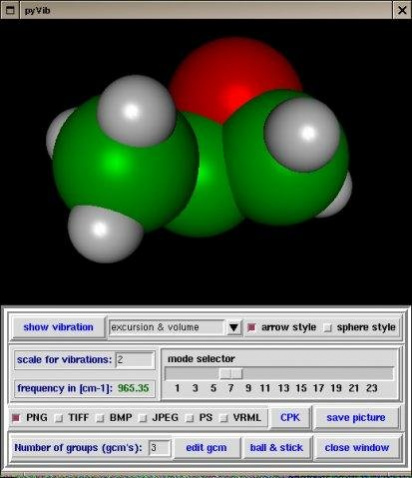
pyVib is a Python-based molecular graphics visualizer. It allows visualizing vibrational modes (from latest gaussian fchk files), the related IR/VCD/Raman/ROA spectra, the GCM's (group coupling matrices) and ACP's (atomic...
pyVib is a Python-based molecular graphics visualizer. It allows visualizing vibrational modes (from latest gaussian fchk files), the related IR/VCD/Raman/ROA spectra, the GCM's (group coupling matrices) and ACP's (atomic contribution patterns).
Previous Versions
Here you can find the changelog of pyVib Molecular Graphics Program since it was posted on our website on 2015-04-26 03:00:00.
The latest version is 1.0.2 and it was updated on 2024-04-22 16:24:19. See below the changes in each version.
pyVib Molecular Graphics Program version pyvib-1.0.2_winXP
Updated At: 2007-04-11
Changes: Several fixes and updates
pyVib Molecular Graphics Program version pyvib-1.0.2_winXP
Updated At: 2007-04-11
Disclaimer
External Download
We do not host pyVib Molecular Graphics Program on our servers. We did not scan it for viruses, adware, spyware or other type of malware. This app is hosted by the software publisher and passed their terms and conditions to be listed there. We recommend caution when installing it.
The external download link for pyVib Molecular Graphics Program is provided to you by apps112.com without any warranties, representations or guarantees of any kind, so access it at your own risk.
If you have questions regarding this particular app contact the publisher directly. For questions about the functionalities of apps112.com contact us.